Matplotlib:多线图
| 日期 | 2017-07-13(最后修改),2006-01-22(创建) |
|---|
多线图
通常人们希望将多个信号绘制在一起。有几种方法可以做到这一点。最简单的实现方法是为每个信号添加一个常数偏移量
In [ ]
from pylab import plot, show, ylim, yticks
from matplotlib.numerix import sin, cos, exp, pi, arange

t = arange(0.0, 2.0, 0.01)
s1 = sin(2*pi*t)
s2 = exp(-t)
s3 = sin(2*pi*t)*exp(-t)
s4 = sin(2*pi*t)*cos(4*pi*t)

t = arange(0.0, 2.0, 0.01)
plot(t, s1, t, s2+1, t, s3+2, t, s4+3, color='k')
ylim(-1,4)
yticks(arange(4), ['S1', 'S2', 'S3', 'S4'])

show()
但是这样很难以合理的方式更改 y 轴比例。例如,当你放大 y 轴时,顶部和底部的信号会超出屏幕。通常人们希望每个信号的 y 位置保持不变,而信号的增益发生变化。
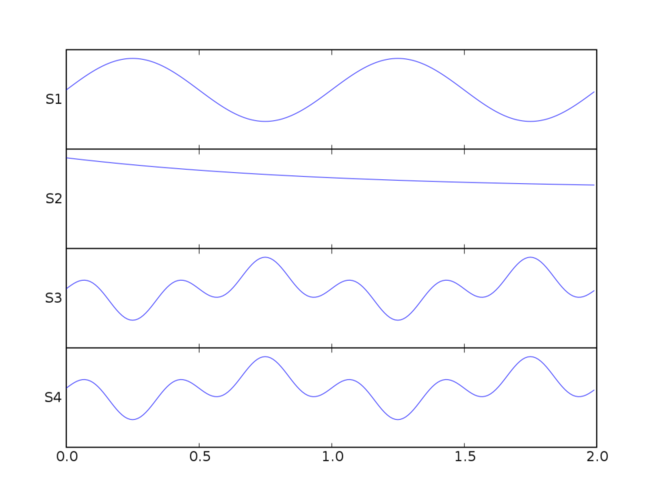
使用多个轴
如果你只有几个信号,你可以将每个信号设置为一个单独的轴,并将 y 轴标签设置为水平方向。这对于少量信号(例如 4-10 个)来说效果很好,除了轴周围的额外水平线和刻度可能会让人感到厌烦。我们计划更改这些轴线的绘制方式,以便你可以将其删除,但目前还没有完成。
In [ ]
from pylab import figure, show, setp
from matplotlib.numerix import sin, cos, exp, pi, arange

t = arange(0.0, 2.0, 0.01)
s1 = sin(2*pi*t)
s2 = exp(-t)
s3 = sin(2*pi*t)*exp(-t)
s4 = sin(2*pi*t)*cos(4*pi*t)

fig = figure()
t = arange(0.0, 2.0, 0.01)

yprops = dict(rotation=0,
              horizontalalignment='right',
              verticalalignment='center',
              x=-0.01)

axprops = dict(yticks=[])

ax1 =fig.add_axes([0.1, 0.7, 0.8, 0.2], **axprops)
ax1.plot(t, s1)
ax1.set_ylabel('S1', **yprops)

axprops['sharex'] = ax1
axprops['sharey'] = ax1
# force x axes to remain in register, even with toolbar navigation
ax2 = fig.add_axes([0.1, 0.5, 0.8, 0.2], **axprops)

ax2.plot(t, s2)
ax2.set_ylabel('S2', **yprops)

ax3 = fig.add_axes([0.1, 0.3, 0.8, 0.2], **axprops)
ax3.plot(t, s4)
ax3.set_ylabel('S3', **yprops)

ax4 = fig.add_axes([0.1, 0.1, 0.8, 0.2], **axprops)
ax4.plot(t, s4)
ax4.set_ylabel('S4', **yprops)

# turn off x ticklabels for all but the lower axes
for ax in ax1, ax2, ax3:
    setp(ax.get_xticklabels(), visible=False)

show()

操作变换
对于大量线条,上述方法效率低下,因为为每条线创建单独的轴会产生大量无用的开销。产生 matplotlib 的应用程序是一个 脑电图查看器,它必须有效地处理数百条线;它作为 pbrain 包 的一部分提供。
以下是如何使用“就地”增益更改进行多线绘图的示例。请注意,这将破坏工具栏的 y 行为,因为我们更改了所有默认变换。在我的应用程序中,我有一个自定义工具栏来增加或减少 y 缩放比例。在这个例子中,我将加号/减号键绑定到一个函数,该函数增加或减少 y 增益。也许我会把它包装成一个名为 plot_signals 的函数或类似的东西,因为代码有点乱,因为它大量使用了有点神秘的 matplotlib 变换。我建议在尝试理解此示例之前阅读有关 变换模块 的内容。
In [ ]
from pylab import figure, show, setp, connect, draw
from matplotlib.numerix import sin, cos, exp, pi, arange
from matplotlib.numerix.mlab import mean
from matplotlib.transforms import Bbox, Value, Point, \
     get_bbox_transform, unit_bbox
# load the data

t = arange(0.0, 2.0, 0.01)
s1 = sin(2*pi*t)
s2 = exp(-t)
s3 = sin(2*pi*t)*exp(-t)
s4 = sin(2*pi*t)*cos(4*pi*t)
s5 = s1*s2
s6 = s1-s4
s7 = s3*s4-s1

signals = s1, s2, s3, s4, s5, s6, s7
for sig in signals:
    sig = sig-mean(sig)

lineprops = dict(linewidth=1, color='black', linestyle='-')
fig = figure()
ax = fig.add_axes([0.1, 0.1, 0.8, 0.8])

# The normal matplotlib transformation is the view lim bounding box
# (ax.viewLim) to the axes bounding box (ax.bbox).  Where are going to
# define a new transform by defining a new input bounding box. See the
# matplotlib.transforms module helkp for more information on
# transforms

# This bounding reuses the x data of the viewLim for the xscale -10 to
# 10 on the y scale.  -10 to 10 means that a signal with a min/max
# amplitude of 10 will span the entire vertical extent of the axes
scale = 10
boxin = Bbox(
    Point(ax.viewLim.ll().x(), Value(-scale)),
    Point(ax.viewLim.ur().x(), Value(scale)))


# height is a lazy value
height = ax.bbox.ur().y() - ax.bbox.ll().y()

boxout = Bbox(
    Point(ax.bbox.ll().x(), Value(-0.5) * height),
    Point(ax.bbox.ur().x(), Value( 0.5) * height))


# matplotlib transforms can accepts an offset, which is defined as a
# point and another transform to map that point to display.  This
# transform maps x as identity and maps the 0-1 y interval to the
# vertical extent of the yaxis.  This will be used to offset the lines
# and ticks vertically
transOffset = get_bbox_transform(
    unit_bbox(),
    Bbox( Point( Value(0), ax.bbox.ll().y()),
          Point( Value(1), ax.bbox.ur().y())
          ))

# now add the signals, set the transform, and set the offset of each
# line
ticklocs = []
for i, s in enumerate(signals):
    trans = get_bbox_transform(boxin, boxout)
    offset = (i+1.)/(len(signals)+1.)
    trans.set_offset( (0, offset), transOffset)

    ax.plot(t, s, transform=trans, **lineprops)
    ticklocs.append(offset)


ax.set_yticks(ticklocs)
ax.set_yticklabels(['S%d'%(i+1) for i in range(len(signals))])

# place all the y tick attributes in axes coords
all = []
labels = []
ax.set_yticks(ticklocs)
for tick in ax.yaxis.get_major_ticks():
    all.extend(( tick.label1, tick.label2, tick.tick1line,
                 tick.tick2line, tick.gridline))
    labels.append(tick.label1)

setp(all, transform=ax.transAxes)
setp(labels, x=-0.01)

ax.set_xlabel('time (s)')


# Because we have hacked the transforms, you need a special method to
# set the voltage gain; this is a naive implementation of how you
# might want to do this in real life (eg make the scale changes
# exponential rather than linear) but it gives you the idea
def set_ygain(direction):
    set_ygain.scale += direction
    if set_ygain.scale <=0:
        set_ygain.scale -= direction
        return

    for line in ax.lines:
        trans = line.get_transform()
        box1 =  trans.get_bbox1()
        box1.intervaly().set_bounds(-set_ygain.scale, set_ygain.scale)
    draw()
set_ygain.scale = scale

def keypress(event):
    if event.key in ('+', '='): set_ygain(-1)
    elif event.key in ('-', '_'): set_ygain(1)

connect('key_press_event', keypress)
ax.set_title('Use + / - to change y gain')
show()
章节作者:AndrewStraw、GaelVaroquaux、Christian Gagnon
附件