Matplotlib:地图
| 日期 | 2017-07-13(最后修改),2006-01-22(创建) |
|---|
使用 basemap 工具包可以轻松地在地图投影上绘制数据。工具包是特定于应用程序的函数集合,它们扩展了 matplotlib。
basemap 工具包不在默认的 matplotlib 安装中 - 你可以从 matplotlib sourceforge 下载页面 下载它。
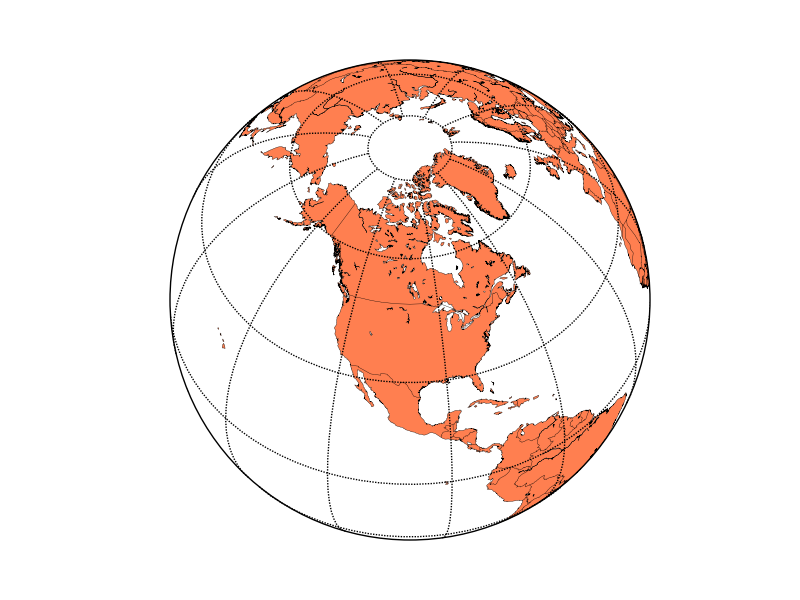
假设你想使用正射投影(或卫星投影)制作世界地图,并在上面绘制一些数据。以下是如何制作地图(使用 matplotlib >= 0.98.0 和 basemap >= 0.99)
In [ ]
from mpl_toolkits.basemap import Basemap
import matplotlib.pyplot as plt
import numpy as np
# set up orthographic map projection with
# perspective of satellite looking down at 50N, 100W.
# use low resolution coastlines.
# don't plot features that are smaller than 1000 square km.
map = Basemap(projection='ortho', lat_0 = 50, lon_0 = -100,
              resolution = 'l', area_thresh = 1000.)
# draw coastlines, country boundaries, fill continents.
map.drawcoastlines()
map.drawcountries()
map.fillcontinents(color = 'coral')
# draw the edge of the map projection region (the projection limb)
map.drawmapboundary()
# draw lat/lon grid lines every 30 degrees.
map.drawmeridians(np.arange(0, 360, 30))
map.drawparallels(np.arange(-90, 90, 30))
plt.show()
还有许多其他地图投影可用,可能比你以前听说过的还要多。完整的列表可以在 basemap 文档字符串 中找到。海岸线、政治边界和河流有四种分辨率, , , 和 。以下是分辨率海岸线的样子。

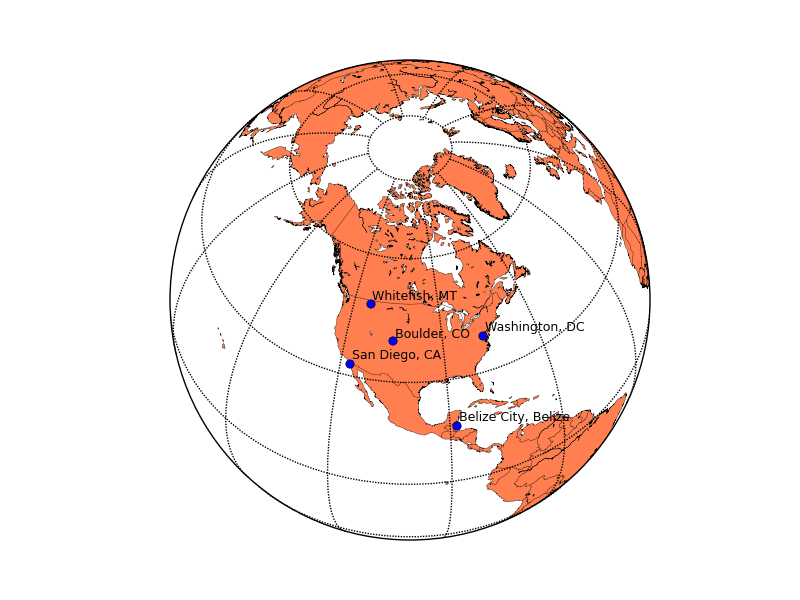
现在,假设你想在地图上绘制五个城市的地理位置。在上面脚本中的 之前添加以下内容
In [ ]
# lat/lon coordinates of five cities.
lats = [40.02, 32.73, 38.55, 48.25, 17.29]
lons = [-105.16, -117.16, -77.00, -114.21, -88.10]
cities=['Boulder, CO','San Diego, CA',
        'Washington, DC','Whitefish, MT','Belize City, Belize']
# compute the native map projection coordinates for cities.
x,y = map(lons,lats)
# plot filled circles at the locations of the cities.
map.plot(x,y,'bo')
# plot the names of those five cities.
for name,xpt,ypt in zip(cities,x,y):
    plt.text(xpt+50000,ypt+50000,name)

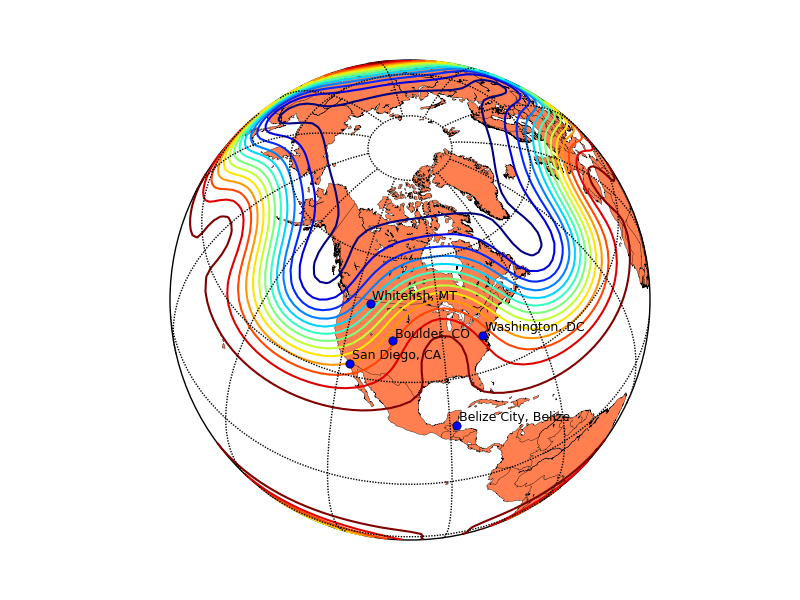
使用经度和纬度数组调用底图类实例会使用 proj4 库将这些位置返回到本地地图投影坐标中。现在假设您在规则的经纬度网格上有一些数据,并且您想在该地图上绘制这些数据的等高线。尝试在之前添加以下几行
In [ ]
# make up some data on a regular lat/lon grid.
nlats = 73; nlons = 145; delta = 2.*np.pi/(nlons-1)
lats = (0.5*np.pi-delta*np.indices((nlats,nlons))[0,:,:])
lons = (delta*np.indices((nlats,nlons))[1,:,:])
wave = 0.75*(np.sin(2.*lats)**8*np.cos(4.*lons))
mean = 0.5*np.cos(2.*lats)*((np.sin(2.*lats))**2 + 2.)
# compute native map projection coordinates of lat/lon grid.
x, y = map(lons*180./np.pi, lats*180./np.pi)
# contour data over the map.
CS = map.contour(x,y,wave+mean,15,linewidths=1.5)

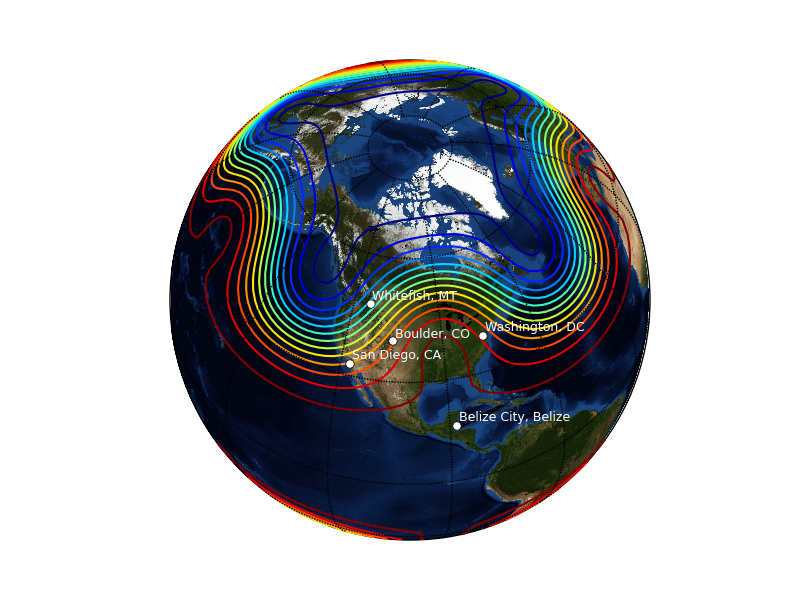
您可以使用该方法将图像用作地图背景,而不是绘制大陆和海岸线。默认背景图像是 NASA 的“蓝色弹珠”图像,您可以通过使用
In [ ]
map.bluemarble()
代替
In [ ]
map.drawcoastlines()
map.drawcountries()
map.fillcontinents(color='coral')
以下是生成的绘图(使用白色文本而不是黑色,以及白色点而不是蓝色)

您还可以绘制图像、pcolor 图和向量到地图投影上。在 basemap 源代码分发包的示例目录中可以找到说明此功能以及更多功能的示例。
章节作者:AndrewStraw、Unknown[97]、GaelVaroquaux、Unknown[16]、Unknown[105]、Christian Gagnon
附件