Matplotlib:Lotka-Volterra 教程
| 日期 | 2017-03-12(最后修改),2007-11-11(创建) |
|---|
- 页面已从 LoktaVolterraTutorial 重命名
此示例描述了如何使用 scipy.integrate 模块集成 ODE,以及如何使用 matplotlib 模块绘制轨迹、方向场和其他信息。
您可以在此处获取本教程的源代码:tutorial_lokta-voltera_v4.py.
Lotka-Volterra 模型介绍
我们将看一下 Lotka-Volterra 模型,也称为捕食者-猎物方程,它是一对一阶非线性微分方程,通常用于描述两个物种相互作用的生物系统动力学,其中一个物种是捕食者,另一个是猎物。该模型由 Alfred J. Lotka 于 1925 年和 Vito Volterra 于 1926 年独立提出,可以用以下公式描述
du/dt = au - buv
dv/dt = -cv + dbu*v
使用以下符号
u:猎物数量(例如,兔子)
v:捕食者数量(例如,狐狸)
a、b、c、d 是定义种群行为的常数参数
a 表示兔子在没有狐狸的情况下自然增长率。
b 表示兔子由于捕食而自然死亡率。
c 表示狐狸在没有兔子情况下自然死亡率。
d 表示捕获的兔子数量与新狐狸数量之间的关系。
我们将使用 X=[u, v] 来描述两种种群的状态。
方程定义
#!python
from numpy import *
import pylab as p
# Definition of parameters
a = 1.
b = 0.1
c = 1.5
d = 0.75
def dX_dt(X, t=0):
    """ Return the growth rate of fox and rabbit populations. """
    return array([ a*X[0] -   b*X[0]*X[1] ,
                  -c*X[1] + d*b*X[0]*X[1] ])
种群平衡
在使用 !SciPy 对该系统进行积分之前,我们将仔细研究位置平衡。平衡发生在增长率等于 0 时。这给出了两个固定点
#!python
X_f0 = array([     0. ,  0.])
X_f1 = array([ c/(d*b), a/b])
all(dX_dt(X_f0) == zeros(2) ) and all(dX_dt(X_f1) == zeros(2)) # => True
固定点的稳定性
在这两个点附近,系统可以线性化:dX_dt = A_f*X,其中 A 是在对应点处计算的雅可比矩阵。我们需要定义雅可比矩阵
#!python
def d2X_dt2(X, t=0):
    """ Return the Jacobian matrix evaluated in X. """
    return array([[a -b*X[1],   -b*X[0]     ],
                  [b*d*X[1] ,   -c +b*d*X[0]] ])
因此,在 X_f0 附近,它代表了两种物种的灭绝,我们有
#! python
A_f0 = d2X_dt2(X_f0)                    # >>> array([[ 1. , -0. ],
                                        #            [ 0. , -1.5]])
在 X_f0 附近,兔子数量增加,狐狸数量减少。因此,原点是一个 鞍点。
在 X_f1 附近,我们有
#!python
A_f1 = d2X_dt2(X_f1)                    # >>> array([[ 0.  , -2.  ],
                                        #            [ 0.75,  0.  ]])
# whose eigenvalues are +/- sqrt(c*a).j:
lambda1, lambda2 = linalg.eigvals(A_f1) # >>> (1.22474j, -1.22474j)
# They are imaginary numbers. The fox and rabbit populations are periodic as follows from further
# analysis. Their period is given by:
T_f1 = 2*pi/abs(lambda1)                # >>> 5.130199
使用 scipy.integrate 对 ODE 进行积分
现在,我们将使用 scipy.integrate 模块对 ODE 进行积分。该模块提供了一个名为 odeint 的方法,该方法非常易于用于对 ODE 进行积分
#!python
from scipy import integrate
t = linspace(0, 15,  1000)              # time
X0 = array([10, 5])                     # initials conditions: 10 rabbits and 5 foxes
X, infodict = integrate.odeint(dX_dt, X0, t, full_output=True)
infodict['message']                     # >>> 'Integration successful.'
`infodict` 是可选的,如果您不需要它,可以省略 `full_output` 参数。如果您想了解更多关于 odeint 输入和输出的信息,请键入 "info(odeint)"。
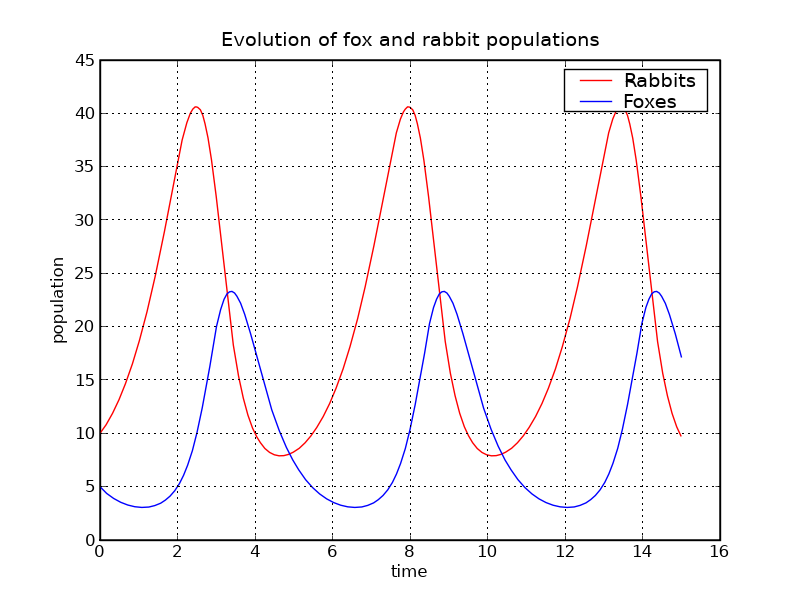
现在,我们可以使用 Matplotlib 来绘制两种种群的演变
#!python
rabbits, foxes = X.T
f1 = p.figure()
p.plot(t, rabbits, 'r-', label='Rabbits')
p.plot(t, foxes  , 'b-', label='Foxes')
p.grid()
p.legend(loc='best')
p.xlabel('time')
p.ylabel('population')
p.title('Evolution of fox and rabbit populations')
f1.savefig('rabbits_and_foxes_1.png')

种群确实是周期性的,它们的周期接近我们计算的 T_f1 值。
在相平面中绘制方向场和轨迹
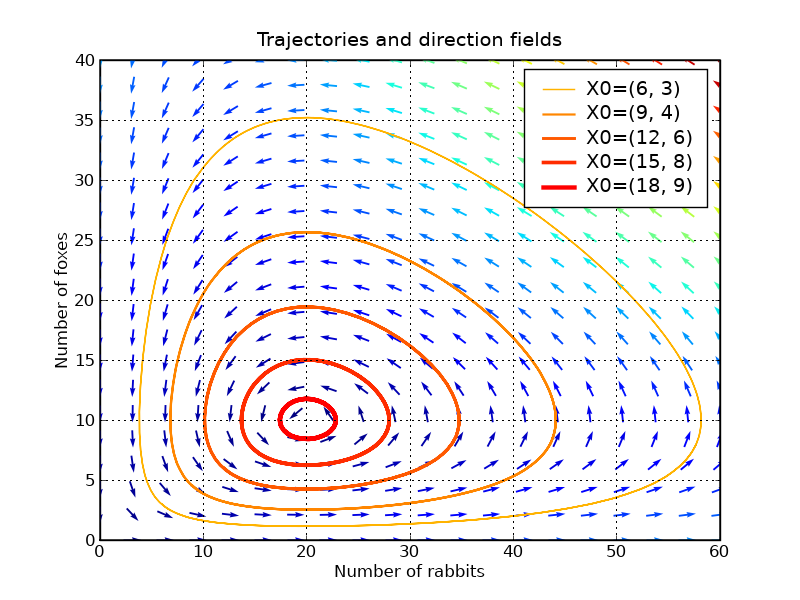
我们将绘制一些在 X_f0 和 X_f1 之间的不同起点处的相平面中的轨迹。
我们将使用 Matplotlib 的颜色映射来定义轨迹的颜色。这些颜色映射非常有用,可以制作漂亮的绘图。如果您想了解更多信息,请查看 ShowColormaps。
values  = linspace(0.3, 0.9, 5)                          # position of X0 between X_f0 and X_f1
vcolors = p.cm.autumn_r(linspace(0.3, 1., len(values)))  # colors for each trajectory

f2 = p.figure()

#-------------------------------------------------------
# plot trajectories
for v, col in zip(values, vcolors):
    X0 = v * X_f1                               # starting point
    X = integrate.odeint( dX_dt, X0, t)         # we don't need infodict here
    p.plot( X[:,0], X[:,1], lw=3.5*v, color=col, label='X0=(%.f, %.f)' % ( X0[0], X0[1]) )

#-------------------------------------------------------
# define a grid and compute direction at each point
ymax = p.ylim(ymin=0)[1]                        # get axis limits
xmax = p.xlim(xmin=0)[1]
nb_points   = 20

x = linspace(0, xmax, nb_points)
y = linspace(0, ymax, nb_points)

X1 , Y1  = meshgrid(x, y)                       # create a grid
DX1, DY1 = dX_dt([X1, Y1])                      # compute growth rate on the gridt
M = (hypot(DX1, DY1))                           # Norm of the growth rate
M[ M == 0] = 1.                                 # Avoid zero division errors
DX1 /= M                                        # Normalize each arrows
DY1 /= M

#-------------------------------------------------------
# Drow direction fields, using matplotlib 's quiver function
# I choose to plot normalized arrows and to use colors to give information on
# the growth speed
p.title('Trajectories and direction fields')
Q = p.quiver(X1, Y1, DX1, DY1, M, pivot='mid', cmap=p.cm.jet)
p.xlabel('Number of rabbits')
p.ylabel('Number of foxes')
p.legend()
p.grid()
p.xlim(0, xmax)
p.ylim(0, ymax)
f2.savefig('rabbits_and_foxes_2.png')

该图向我们展示了改变狐狸或兔子种群数量可能会产生非直观的效应。如果为了减少兔子数量,我们引入了狐狸,这可能会导致兔子数量在长期内增加,具体取决于干预的时间。
绘制等高线
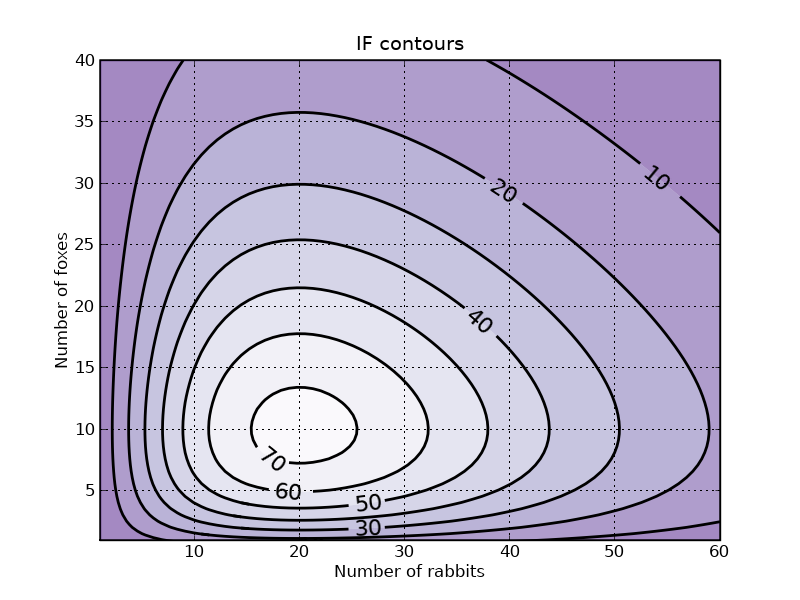
我们可以验证下面定义的函数 IF 在轨迹上保持不变
#!python
def IF(X):
    u, v = X
    return u**(c/a) * v * exp( -(b/a)*(d*u+v) )
# We will verify that IF remains constant for different trajectories
for v in values:
    X0 = v * X_f1                               # starting point
    X = integrate.odeint( dX_dt, X0, t)
    I = IF(X.T)                                 # compute IF along the trajectory
    I_mean = I.mean()
    delta = 100 * (I.max()-I.min())/I_mean
    print 'X0=(%2.f,%2.f) => I ~ %.1f |delta = %.3G %%' % (X0[0], X0[1], I_mean, delta)
# >>> X0=( 6, 3) => I ~ 20.8 |delta = 6.19E-05 %
#     X0=( 9, 4) => I ~ 39.4 |delta = 2.67E-05 %
#     X0=(12, 6) => I ~ 55.7 |delta = 1.82E-05 %
#     X0=(15, 8) => I ~ 66.8 |delta = 1.12E-05 %
#     X0=(18, 9) => I ~ 72.4 |delta = 4.68E-06 %
绘制 IF 的等高线可以很好地表示轨迹,而无需对 ODE 进行积分
#!python
#-------------------------------------------------------
# plot iso contours
nb_points = 80                              # grid size
x = linspace(0, xmax, nb_points)
y = linspace(0, ymax, nb_points)
X2 , Y2  = meshgrid(x, y)                   # create the grid
Z2 = IF([X2, Y2])                           # compute IF on each point
f3 = p.figure()
CS = p.contourf(X2, Y2, Z2, cmap=p.cm.Purples_r, alpha=0.5)
CS2 = p.contour(X2, Y2, Z2, colors='black', linewidths=2. )
p.clabel(CS2, inline=1, fontsize=16, fmt='%.f')
p.grid()
p.xlabel('Number of rabbits')
p.ylabel('Number of foxes')
p.ylim(1, ymax)
p.xlim(1, xmax)
p.title('IF contours')
f3.savefig('rabbits_and_foxes_3.png')
p.show()

章节作者:PauliVirtanen,Bhupendra
附件
rabbits_and_foxes_1.pngrabbits_and_foxes_1v2.pngrabbits_and_foxes_2.pngrabbits_and_foxes_2v2.pngrabbits_and_foxes_2v3.pngrabbits_and_foxes_3.pngrabbits_and_foxes_3v2.pngtutorial_lokta-voltera.pytutorial_lokta-voltera_v2.pytutorial_lokta-voltera_v3.pytutorial_lokta-voltera_v4.pyzombie_nodead_nobirths.pngzombie_somedead_10births.pngzombie_somedead_nobirths.pngzombie_somedeaddead_nobirths.png