Matplotlib:对不规则间隔数据进行网格化
| 日期 | 2011-09-07(最后修改),2006-01-22(创建) |
|---|
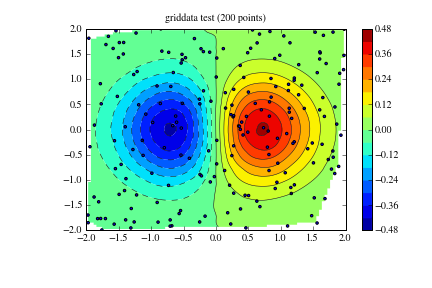
在 matplotlib 邮件列表中,一个常见的问题是“如何对我的不规则间隔数据进行等高线图?”。答案是,首先你需要将其插值到一个规则网格上。从 0.98.3 版本开始,matplotlib 提供了一个 griddata 函数,其行为类似于 matlab 版本。它对不规则间隔数据进行“自然邻近插值”到一个规则网格上,然后你可以用 contour、imshow 或 pcolor 对其进行绘制。
示例 1
这需要 Scipy 0.9
import numpy as np
from scipy.interpolate import griddata
import matplotlib.pyplot as plt
import numpy.ma as ma
from numpy.random import uniform, seed
# make up some randomly distributed data
seed(1234)
npts = 200
x = uniform(-2,2,npts)
y = uniform(-2,2,npts)
z = x*np.exp(-x**2-y**2)
# define grid.
xi = np.linspace(-2.1,2.1,100)
yi = np.linspace(-2.1,2.1,100)
# grid the data.
zi = griddata((x, y), z, (xi[None,:], yi[:,None]), method='cubic')
# contour the gridded data, plotting dots at the randomly spaced data points.
CS = plt.contour(xi,yi,zi,15,linewidths=0.5,colors='k')
CS = plt.contourf(xi,yi,zi,15,cmap=plt.cm.jet)
plt.colorbar() # draw colorbar
# plot data points.
plt.scatter(x,y,marker='o',c='b',s=5)
plt.xlim(-2,2)
plt.ylim(-2,2)
plt.title('griddata test (%d points)' % npts)
plt.show()

示例 2
import numpy as np
from matplotlib.mlab import griddata
import matplotlib.pyplot as plt
import numpy.ma as ma
from numpy.random import uniform
# make up some randomly distributed data
npts = 200
x = uniform(-2,2,npts)
y = uniform(-2,2,npts)
z = x*np.exp(-x**2-y**2)
# define grid.
xi = np.linspace(-2.1,2.1,100)
yi = np.linspace(-2.1,2.1,100)
# grid the data.
zi = griddata(x,y,z,xi,yi)
# contour the gridded data, plotting dots at the randomly spaced data points.
CS = plt.contour(xi,yi,zi,15,linewidths=0.5,colors='k')
CS = plt.contourf(xi,yi,zi,15,cmap=plt.cm.jet)
plt.colorbar() # draw colorbar
# plot data points.
plt.scatter(x,y,marker='o',c='b',s=5)
plt.xlim(-2,2)
plt.ylim(-2,2)
plt.title('griddata test (%d points)' % npts)
plt.show()
默认情况下,griddata 使用 scikits delaunay 包(包含在 matplotlib 中)来进行自然邻近插值。不幸的是,delaunay 包已知在某些接近病态的情况下会失败。如果你遇到其中一种情况,你可以安装 matplotlib natgrid 工具包。安装完成后,griddata 函数将使用它而不是 delaunay 来进行插值。natgrid 算法更加健壮,但由于许可问题,不能包含在 matplotlib 本身中。
SciPy 沙盒中的径向基函数模块也可以用于对 n 维散点数据进行插值/平滑。有关详细信息,请参见 ["Cookbook/RadialBasisFunctions"]。
示例 3
下面代码中展示了一种不太健壮但可能更直观的做法。此函数接受三个一维数组,即两个独立数据数组和一个因变量数据数组,并将它们归类到一个二维网格中。除此之外,代码还返回另外两个网格,其中一个网格中每个归类值代表该归类中的点数,另一个网格中每个归类包含原始因变量数组中包含在该归类中的索引。如果需要,这些索引可以进一步用于插值归类之间的值。
这本质上是 matplotlib.mlab griddata 函数的奥卡姆剃刀方法,因为两者都产生类似的结果。
# griddata.py - 2010-07-11 ccampo
import numpy as np

def griddata(x, y, z, binsize=0.01, retbin=True, retloc=True):
    """
    Place unevenly spaced 2D data on a grid by 2D binning (nearest
    neighbor interpolation).

    Parameters
    ----------
    x : ndarray (1D)
        The idependent data x-axis of the grid.
    y : ndarray (1D)
        The idependent data y-axis of the grid.
    z : ndarray (1D)
        The dependent data in the form z = f(x,y).
    binsize : scalar, optional
        The full width and height of each bin on the grid.  If each
        bin is a cube, then this is the x and y dimension.  This is
        the step in both directions, x and y. Defaults to 0.01.
    retbin : boolean, optional
        Function returns `bins` variable (see below for description)
        if set to True.  Defaults to True.
    retloc : boolean, optional
        Function returns `wherebins` variable (see below for description)
        if set to True.  Defaults to True.

    Returns
    -------
    grid : ndarray (2D)
        The evenly gridded data.  The value of each cell is the median
        value of the contents of the bin.
    bins : ndarray (2D)
        A grid the same shape as `grid`, except the value of each cell
        is the number of points in that bin.  Returns only if
        `retbin` is set to True.
    wherebin : list (2D)
        A 2D list the same shape as `grid` and `bins` where each cell
        contains the indicies of `z` which contain the values stored
        in the particular bin.

    Revisions
    ---------
    2010-07-11  ccampo  Initial version
    """
    # get extrema values.
    xmin, xmax = x.min(), x.max()
    ymin, ymax = y.min(), y.max()

    # make coordinate arrays.
    xi      = np.arange(xmin, xmax+binsize, binsize)
    yi      = np.arange(ymin, ymax+binsize, binsize)
    xi, yi = np.meshgrid(xi,yi)

    # make the grid.
    grid           = np.zeros(xi.shape, dtype=x.dtype)
    nrow, ncol = grid.shape
    if retbin: bins = np.copy(grid)

    # create list in same shape as grid to store indices
    if retloc:
        wherebin = np.copy(grid)
        wherebin = wherebin.tolist()

    # fill in the grid.
    for row in range(nrow):
        for col in range(ncol):
            xc = xi[row, col]    # x coordinate.
            yc = yi[row, col]    # y coordinate.

            # find the position that xc and yc correspond to.
            posx = np.abs(x - xc)
            posy = np.abs(y - yc)
            ibin = np.logical_and(posx < binsize/2., posy < binsize/2.)
            ind  = np.where(ibin == True)[0]

            # fill the bin.
            bin = z[ibin]
            if retloc: wherebin[row][col] = ind
            if retbin: bins[row, col] = bin.size
            if bin.size != 0:
                binval         = np.median(bin)
                grid[row, col] = binval
            else:
                grid[row, col] = np.nan   # fill empty bins with nans.

    # return the grid
    if retbin:
        if retloc:
            return grid, bins, wherebin
        else:
            return grid, bins
    else:
        if retloc:
            return grid, wherebin
        else:
            return grid
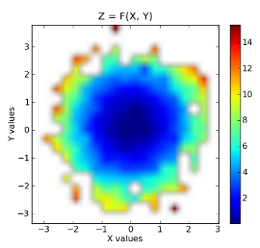
以下示例演示了此方法的使用。
import numpy as np
import matplotlib.pyplot as plt
import griddata

npr = np.random
npts = 3000.                            # the total number of data points.
x = npr.normal(size=npts)            # create some normally distributed dependent data in x.
y = npr.normal(size=npts)            # ... do the same for y.
zorig = x**2 + y**2                      # z is a function of the form z = f(x, y).
noise = npr.normal(scale=1.0, size=npts) # add a good amount of noise
z = zorig + noise                    # z = f(x, y) = x**2 + y**2

# plot some profiles / cross-sections for some visualization.  our
# function is a symmetric, upward opening paraboloid z = x**2 + y**2.
# We expect it to be symmetric about and and y, attain a minimum on
# the origin and display minor Gaussian noise.

plt.ion()   # pyplot interactive mode on

# x vs z cross-section.  notice the noise.
plt.plot(x, z, '.')
plt.title('X vs Z=F(X,Y=constant)')
plt.xlabel('X')
plt.ylabel('Z')

# y vs z cross-section.  notice the noise.
plt.plot(y, z, '.')
plt.title('Y vs Z=F(Y,X=constant)')
plt.xlabel('Y')
plt.ylabel('Z')

# now show the dependent data (x vs y).  we could represent the z data
# as a third axis by either a 3d plot or contour plot, but we need to
# grid it first....
plt.plot(x, y, '.')
plt.title('X vs Y')
plt.xlabel('X')
plt.ylabel('Y')

# enter the gridding.  imagine drawing a symmetrical grid over the
# plot above.  the binsize is the width and height of one of the grid
# cells, or bins in units of x and y.
binsize = 0.3
grid, bins, binloc = griddata.griddata(x, y, z, binsize=binsize)  # see this routine's docstring


# minimum values for colorbar. filter our nans which are in the grid
zmin    = grid[np.where(np.isnan(grid) == False)].min()
zmax    = grid[np.where(np.isnan(grid) == False)].max()

# colorbar stuff
palette = plt.matplotlib.colors.LinearSegmentedColormap('jet3',plt.cm.datad['jet'],2048)
palette.set_under(alpha=0.0)

# plot the results.  first plot is x, y vs z, where z is a filled level plot.
extent = (x.min(), x.max(), y.min(), y.max()) # extent of the plot
plt.subplot(1, 2, 1)
plt.imshow(grid, extent=extent, cmap=palette, origin='lower', vmin=zmin, vmax=zmax, aspect='auto', interpolation='bilinear')
plt.xlabel('X values')
plt.ylabel('Y values')
plt.title('Z = F(X, Y)')
plt.colorbar()

# now show the number of points in each bin.  since the independent data are
# Gaussian distributed, we expect a 2D Gaussian.
plt.subplot(1, 2, 2)
plt.imshow(bins, extent=extent, cmap=palette, origin='lower', vmin=0, vmax=bins.max(), aspect='auto', interpolation='bilinear')
plt.xlabel('X values')
plt.ylabel('Y values')
plt.title('X, Y vs The No. of Pts Per Bin')
plt.colorbar()
归类数据: 
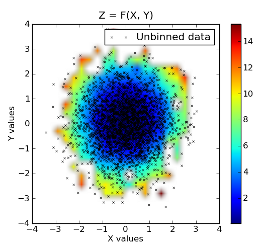
原始数据叠加在归类数据之上: 
章节作者:AndrewStraw,Unknown[95],Unknown[55],Unknown[96],Unknown[97],Unknown[13],ChristopherCampo,PauliVirtanen,WarrenWeckesser,Unknown[98]
附件